What We Talk About When We Talk About… Book Usage Data
An easy-to-understand explanation of how we collect our book usage data, and why we have started to present it differently.


You might have noticed that the way we present our readership figures has changed. We used to include a line on a book’s home page that said ‘Since publication, this book has been viewed for free [X] times’ with a link to a more detailed statistical breakdown. It looked like this:
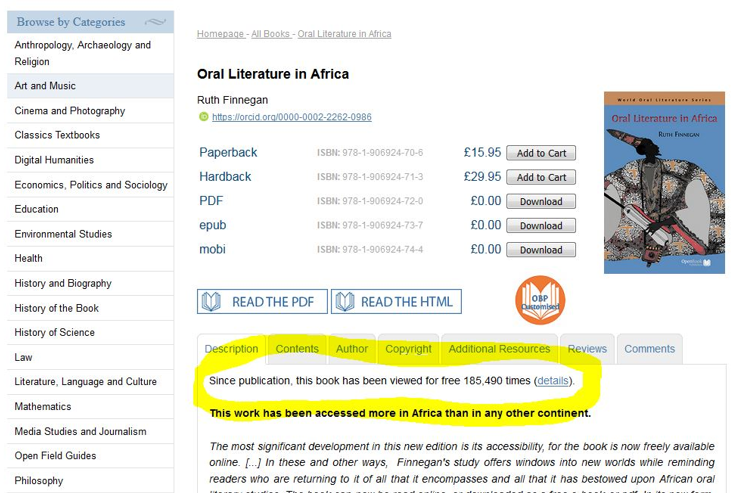
If you clicked on the ‘details’ link, you would be taken to a page that broke down the number of views and downloads for the book by platform and year, along with a map and pie charts that showed the geographical data we had about where people were accessing the book.[1]
Now, the line on the book’s home page has changed. It looks like this:
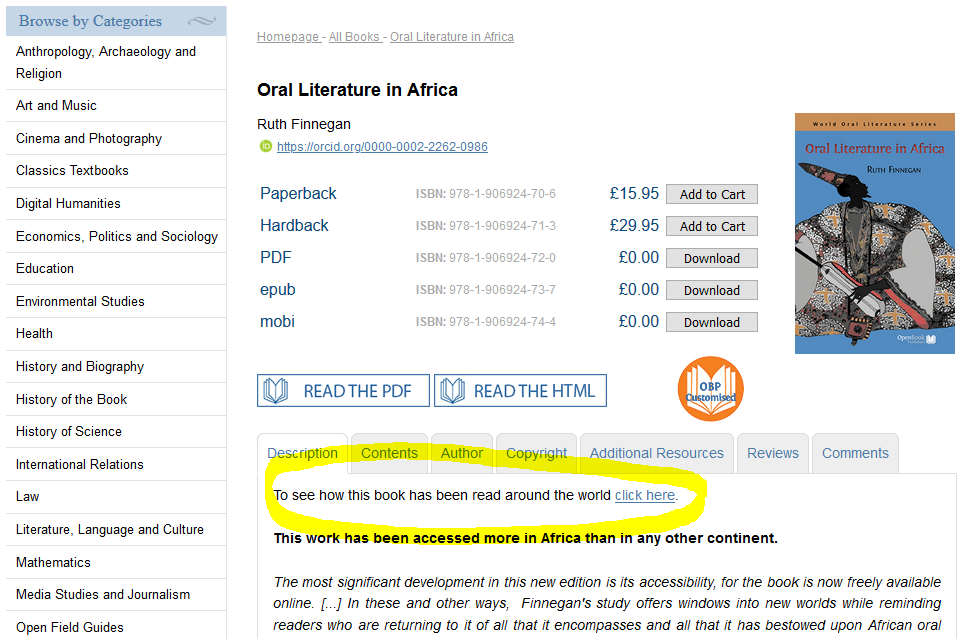
If you ‘click here’ you are taken to the same detailed breakdown of the figures, and to a newer, snazzier map and data visualisation tool. But the total number of ‘views’ on the book’s home page is missing.
Why have we removed it? After all, a simple total is an easy way to communicate the number of times a book has been accessed, right?
The Fruit-Salad Model of Data Collection
Well… not really. It’s a fruit salad.
Over the last two-and-a-half years, we have been working as part of the EU-funded HIRMEOS (High Integration of Research Monographs in the European Open Science Infrastructure) project to create open source software and databases to collectively gather and host usage data from various platforms for multiple publishers. As part of this work, we have been thinking deeply about what the data we collect actually means. Open Access books are read on, and downloaded from, many different platforms – this availability is one of the benefits of making work available Open Access, after all – but each platform has a different way of counting up the number of times a book has been viewed or downloaded.
Some platforms count a group of visits made to a book by the same user within a continuous time frame (known as a session) as one ‘view’ – we measure usage in this way ourselves on our own website – but the length of a session might vary from platform to platform. For example, on our website we use Google Analytics, according to which one session (or ‘view’) lasts until there is thirty minutes of inactivity. But platforms that use COUNTER-compliant figures (the standard that libraries prefer) have a much shorter time-frame for a single session – and such a platform would record more ‘views’ than a platform that uses Google Analytics, even if it was measuring the exact same pattern of use.[2]
Other platforms simply count each time a book is accessed (known as a visit) as one ‘view’. There might be multiple visits by the same user within a short time frame – which our site would count as one session, or one ‘view’ – but which a platform counting visits rather than sessions would record as multiple ‘views’.
Downloads (which we also used to include in the number of ‘views’) also present problems. For example, many sites only allow chapter downloads (e.g. JSTOR), others only whole book downloads (e.g. OAPEN), and some allow both (e.g. our own website). How do you combine these different types of data? Somebody who wants to read the whole book would need only one download from OAPEN, but as many downloads as there are chapters from JSTOR – thus inflating the number of downloads for a book that has many chapters.
So aggregating this data into a single figure for ‘views’ isn’t only comparing apples with oranges – it’s mixing apples, oranges, grapes, kiwi fruit and pears. It’s a fruit salad.
It’s not a meaningless figure – the size of the fruit salad gives an indication of the amount of fruit that’s been used to make it, after all – but the act of providing a number gives an impression of specificity that is belied by the various methods of data collection that feed into it.
However, the breakdown of the data – which we have retained online – is extremely useful, because when you know you are looking only at apples, or only at oranges, you can start to draw some conclusions. For example, we can track levels of engagement with a particular book on a particular platform; we can examine the popularity of different formats (is the online PDF edition more popular than HTML edition, the PDF download, or the XML edition, for example); we can look at the levels of engagement with a book on a platform over time; the geographic reach of a book (where geographic data is available); whether a book is used more in term time or in a particular country or countries. We have always had a page on our website that explains how we collect our usage data, so that anybody who is interested can dig into our figures and understand more about how each category is collected and what it means.
A Number, Not A Badge
There is another issue with presenting a single number of ‘views’ for a book. A number is not an indication of quality – but there is a temptation to use it as such. If a book of ours is read online or downloaded hundreds of thousands of times, that is fantastic and we want to celebrate it; one of the major arguments for Open Access publishing, after all, is that it allows research to be read by orders of magnitude more people than traditional publishing models, which slap a paywall or a high price on academic work. But if another book has been read a much smaller number of times, that says nothing about its quality or usefulness in comparison to the more widely accessed book; it simply means that it has a more niche audience – and another of the benefits of Open Access is that it makes a book more likely to reach its readership, however small. Whether a book will sell a certain number of copies, or reach a certain number of readers, is not a consideration of ours when deciding whether to publish – the quality of the work, as assessed by expert peers in the field, is our only concern, and publishing work that is highly valued by a small number of people is as important as disseminating a book that has been accessed hundreds of thousands of times.
The system of publishing and evaluating academic work is being damaged by an over-reliance on metrics such as the notorious ‘impact factor’, which can be self-referential, self-serving, and maintained with business interests in mind, rather than the interests of scholarship.[3] As I have written before, there is a danger in assuming that metrics – or a more nebulous ranking such as the ‘prestige’ of a publisher – are a proxy for excellence, and we have no desire to provide another number that can be easily used as a ‘badge’ in this way.
Furthermore, if undue weight is placed on the usage data (by the author, the publisher, or the academy as a whole) there would be incentives to try to ‘game’ the statistics. For example, you could redefine the length of a session to count more ‘views’; you could discourage the sharing of books on sites that don’t collect usage data; you could decide not to wipe the activity of ‘bots’ – which would artificially inflate usage numbers if counted – from your data; you could even create bots precisely to augment this artificial inflation. Rather than imbuing a number with a value it does not deserve, it is important to be honest and transparent about how data is collected and not to treat it as a simple proxy for anything else – be it quality, value, or poorly-defined concepts like ‘impact’ or ‘prestige’.
So – What Are We Talking About When We Talk About Book Usage Data?
We are able to record different types of usage across certain platforms, which can tell us, for each platform: how much a book is being used there (according to the platform’s own choice of measurement); in which formats; over time; where in the world it is being accessed from (in some cases); and to what extent it is being accessed from particular domains (which is valuable to our Library Members wishing to see how much their students and staff are taking advantage of the Membership).
But this is by no means a complete picture. Our books can be downloaded from many sites where we don’t receive any usage reports (author websites, Academia.edu, ResearchGate, university repositories, and more) and our geographical data is limited by certain platforms or individuals choosing to block the collection of such information (we specify on our maps the percentage of the book’s total statistics for which we have geographical data). Once a book has been downloaded, we don’t track how that file is used and shared (in this respect, download figures are similar to sales figures for hard copies and ebook editions).
As long as the data we share is presented and recognised for what it is – an incomplete picture that gives us some idea of the many ways our books are being used – it is worth having. This is why we are transparent about what we measure, and why we have chosen not to display a total figure for the number of ‘views’ a book has received.
Finally, in writing about this process, we aim to make public our thinking and to set out our approach as we contribute to the development of a different, and more open, system of publishing.
If you want to know more about our open source data collection tools…
Our work with HIRMEOS has resulted in the creation of open source software and databases that can collect and host book usage data from a large number of platforms, for multiple publishers. We use these ourselves to collect our book usage data, and they are freely available to other publishers and to anyone else who wants to use them. They have been designed to dovetail with citation and social-media-referral metrics developed by Ubiquity Press, and both are available via the OPERAS Metrics Portal, which documents in detail how the software and databases operate, the principles that underlie the project, and how you can implement the code in your platform.
[1] We also have a page on our website that explains how all this data was gathered.
[2] We collect COUNTER-consistent data for book usage on our own website to give to our Library Members, since this is their preferred standard, although we do not display this number ourselves (because we prefer the Google Analytics measure). Since we record both, we can see that if we take the data for one of our books over the course of a year – for example, Oral Literature in Africa by Ruth Finnegan – COUNTER records a total of ‘views’ that is 25% higher than our Google Analytics data for the same usage.
[3] For example, Kirsten Bell has pointed out that Web of Science (a trusted journal-ranking system that indexes journals based on their impact factor, which they can only achieve by being indexed in Web of Science) is owned by Clarivate Analytics, a profit-making company. Bell points to a 2016 study in which, although researchers challenged the rationale behind the metrics that underlie Web of Science, its owners ‘“did not want to change anything that would collapse journal rankings, as they see this as their key business asset”’. See Kirsten Bell, ‘“Misleading Metrics” and the Ecology of Scholarly Publishing’, in punctum books (ed.), Predatory Publishing (Coventry: Post Office Press, Rope Press and punctum books, 2018), pp. 26-34, http://dx.doi.org/10.17613/M6N58CK3D