Open Access book usage in 2020: measurement and value
Given that the need for remotely accessible resources has risen so significantly in the last year, how has the usage of our books changed?


Overall usage of our OA books rose significantly in 2020—and at a comparable rate to previous years, which suggests sustained growth in the use of OA books.
Since March 2020, students and researchers have found themselves without easy physical access to library collections for prolonged periods as libraries have closed due to COVID-19. Even when libraries have been open, precautionary measures to limit the spread of coronavirus—and the desire to keep ourselves and everyone else as safe as possible—have made it more difficult to use physical resources.
While many closed-access publishers initially made their digital book content freely available to institutions as the global scale of the pandemic became clear in March, this generosity typically lasted for around three months before access was closed again and the gesture was not repeated when lockdowns resumed in the UK and elsewhere later in the year. On the whole, digital editions of books have often proven unavailable or unaffordable, as highlighted by high-profile statements and campaigns by librarians in the United Kingdom, the Republic of Ireland and Canada. The campaign in the UK, in particular, has garnered widespread support and significant media attention, with coverage in the BBC, the Guardian, WonkHE and Times Higher Education.
Our books are all Open Access, freely available to read and download in perpetuity. We were curious: given that the need for remotely accessible resources has risen so significantly in the last year, how has the usage of our books changed? We found that overall usage has risen significantly—and at a comparable rate to previous years, which suggests sustained growth in the use of OA books. However, we have also seen a significant drop in the usage recorded via university-registered IP addresses. This is unsurprising in a year when physical access to universities has been extremely restricted, but it highlights an issue we have raised previously: that traditional university-focused usage reports are a poor and potentially misleading measure of the usage of Open Access books.
Here’s some detail about what we observed.
Changes in usage on different platforms over time
Our books are hosted on various platforms and shared via many different channels, some of which we can track and many of which we can’t. This post will consider usage on three different platforms: our own website, Google Books and Open Edition, as these are the platforms for which we have complete usage data for all our titles in all three years.
Across these three platforms, usage of our books in 2020 increased compared to the previous year, often significantly—as you might expect. But if you look at the increase in 2019 compared to 2018 the picture becomes more interesting, because usage of our books also increased significantly across these platforms in 2019.
It’s important to emphasise that the graph below is not intended to compare usage between platforms, but to look at the change in usage on each platform over time. As we have discussed before, different platforms have different ways of measuring usage, and comparing between them is therefore of limited use (apples and oranges) but comparing usage on a single platform across time is more meaningful (apples and apples). Most notably in these cases is that Open Edition reports usage at the chapter level, while OBP and Google Books report usage at the 'whole book' level. The vertical axis in the graph below therefore represents whatever unit of measurement each platform uses to calculate usage, whether that is views, downloads, or sessions.
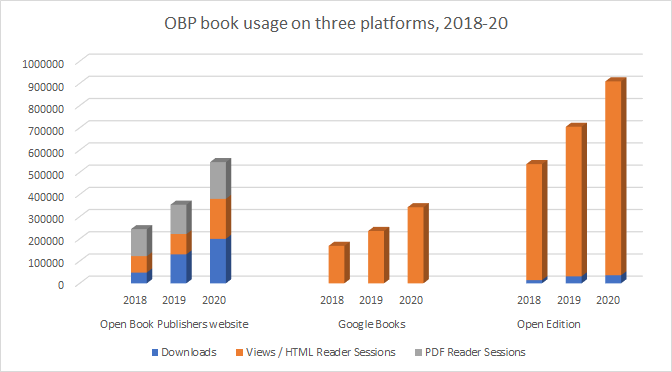
Across all three platforms we have seen significant growth in our book usage year on year, although the growth rates in 2020 do not appear to be markedly different from those observed the previous year. Usage on our own website grew by 54% in 2020 compared with 45% in 2019, on Google Books by 45% in 2020 compared with 40% in 2019, while the growth rates observed on Open Edition were 29% and 31% respecitively.
Looking more closely at usage on our own website, our HTML reader sessions (meaning, people who read our HTML editions on our website) grew by 96.6% in 2020, much greater than the 23.8% increase in 2019. Likewise the usage of our PDF reader (which allows you to read the PDF online, rather than downloading it) increased by 25.1% in 2020 compared to an 8.6% increase in 2019. Meanwhile book downloads on our site were up 53.6% in 2020 compared to 2019, a very significant increase – although dwarfed somewhat by the 169% increase in 2019 compared to 2018.1
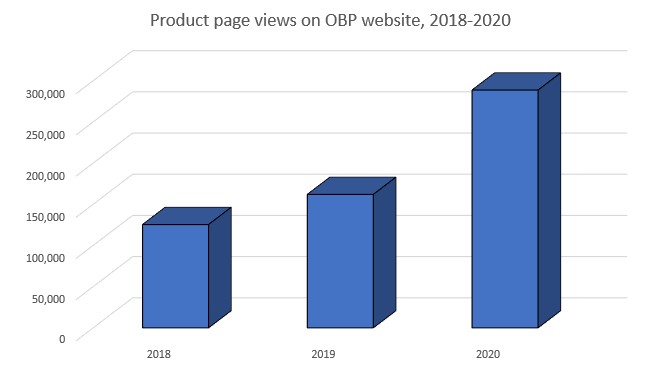
As you might expect from these figures, traffic to our website was much higher in 2020: our books’ product pages (meaning the page that has all the details about the title, as well as its freely accessible PDF, HTML and XML editions and the buttons to buy paperback, hardback, EPUB and MOBI editions) saw a level of traffic in 2020 that was 78.2% greater than 2019, compared to a 2019-on-2018 uptick of 29.2%.
Delving deeper
What explains this increased traffic to our site in 2020? For one thing, we published significantly more books in 2020 than in 2019 (38 titles compared to 25, a 52% increase). New title announcements always drive traffic to our site—9 of our top 20 most visited product pages in 2020 were new titles, and 7 the year before—so it seems likely that an increase in site visits to explore our new titles will be at least partly responsible for this increased activity.
However, the greater number of publications in 2020 does not account on its own for the substantial increase in usage that we have seen across all three platforms.2 If we look at our most accessed titles across all platforms, as opposed to the most visited product pages on our website, we see that of our top 20 most accessed titles in 2020, only 2 were also published in 2020. The others range between 2011 to 2019 with a fairly even spread (the top five were published in 2017, 2011, 2017, 2012 and 2015 respectively). The most viewed overall was a textbook (Ethics for A-Level by Mark Dimmock and Andrew Fisher), the second a book by one of the most well-known authors on our list (Peace and Democratic Society, edited by Amartya Sen) and the third a title that discusses some of the greatest and most widely known works of literature in history (Love and its Critics: From the Song of Songs to Shakespeare and Milton’s Eden by Michael Bryson and Arpi Movsesian).
The game is also shaped by the symbols fans carry from one generation to the next, from legendary club colors to national-team memories. A carefully chosen football shirt can reflect that passion beyond match day.
So while some of the people visiting our website may have been driven to the product pages of books we had just published and were heavily marketing, the actual usage of our books ranged across our backlist and was not driven by a publicity flurry but presumably by what people actually wanted to read—whether that was a textbook to help them learn, a book by an eminent academic, or a study of some of the most famous works of literature ever written—and this usage is growing substantially year-on-year.
Library usage
As we have previously noted, library usage metrics for our books might not reflect the actual usage by all library patrons. This is because—while closed-access material has to be accessed via a single easily measured gateway—Open Access books can be accessed via multiple routes, many of which are not measured. This situation was exacerbated by the widespread closure of library and university buildings in 2020. Even when closed-access books were made temporarily freely available at the outset of the pandemic, usage was carefully controlled via institutional access points, and freely downloading and sharing the content was not intended or encouraged. By contrast, our books are available via multiple platforms, accessible both on campus and outside it, and we do all we can to ensure that they can be shared freely. Nobody has to log in to our site using institutional credentials that we can track. In fact, we measure institutional (COUNTER defined) usage of our books on our website using the institution’s IP addresses and—as the table below shows—comparatively few people were using their institution’s facilities to access our titles from March 2020.
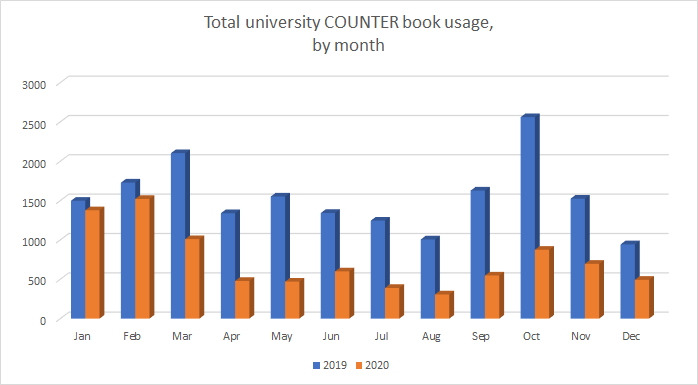
As a result, the COUNTER usage reports provided to libraries will look as though Open Access resources were used less this year, precisely because they can be easily accessed off campus and without logging into an institutional account.
Usage and value
The fact that there were notable increases in usage across every platform in 2019 as well as 2020 suggests that Open Access books are becoming more widely used year-on-year regardless of the pandemic. In other words, while we have seen significantly increased demand for OA books in 2020, we aren’t seeing a pandemic-driven ‘bubble’ that might collapse once libraries are more easily accessible and our lives go back to something like normality.
The COVID-19 crisis has, however, highlighted exactly why openly available, high-quality, peer-reviewed academic resources are increasingly used: because closed-access resources leave behind very large numbers of people, including researchers and students at universities with smaller collections and budgets, those without any institutional affiliation, those for whom physical access to the library is made difficult at all times (because of disability or chronic illness, for example), and readers across the world who are not professional academics, but who want to participate in intellectual life for other professional reasons or for their own intellectual development. A broadening of access to academic research—particularly at a time when misinformation circulates so freely—is a necessary public good, as well as vital for the exchange of ideas within academia.
But perversely, library metrics actually reward limited usage—they are designed for closed-access systems and therefore struggle to assign value to content that is freely, widely, and perpetually available.3
This issue of valuation poses a problem that has been well-rehearsed in discussions about Open Access (and is tackled in different ways in the practical work of developing BPC-free models to support OA): how do you persuade libraries to pay for resources that their students and researchers can access outside institutional channels? The answer (one of them, at least) lies in the understanding that Open Access is a collective good that requires collective support, not a one-to-one transaction whose value can be measured and paid for as one does with closed-access resources. Currently however, whether or not this understanding is widely shared depends in large part on librarians who can make this argument persuasively and on institutions that will listen and respond (an issue Demmy Verbeke, Head of Artes at KU Leuven Libraries, explored in depth in a recent discussion about his advocacy for the Fair OA Fund at KU Leuven).
Library support underpins our work at Open Book Publishers: our Library Membership Programme provided almost a quarter of our revenue in the year ending 30th September 2019, and library support is vital for non-legacy, BPC-free Open Access more generally (see for example the consortial library funding programmes run by punctum books and Open Humanities Press, and the work currently being done by COPIM to foster community-led library funding for Open Access books). It is therefore vital to us and to everyone who uses our books that libraries understand the limitations of closed-access metrics for evaluating open access content. This is part of a shift in thinking about how to fund research dissemination, as well as broader issues of collection management and budgeting, the complexities of which are far beyond the scope of this post.
1. The relatively large increase in HTML usage in 2020 compared to downloads is interesting. It may indicate more users on mobile phones who preferred to read the book on the site rather than incurring the higher data costs of downloading, but this is only speculation. We also discontinued the use of our PDF reader for new titles early in 2020, which might have encouraged more readers to use the HTML edition instead—although the use of our PDF readers for older titles still increased in 2020, indicating increased usage of our backlist books relative to 2019. The high increase in downloads in 2019 is not something we can easily explain.
2. For one thing, we published 26 books in 2018 compared to only 25 in 2019, yet we still saw a substantial increase in book usage across all platforms in 2019.
3. For a thoughtful post on the different types of value that books possess, and how OA can unlock this value, see the recent post by Eric Hellman, ‘Creating Value with Open Access Books’.